The following chapter was authored by Salman Mukhtar and Grace Fedinets and originally published in the second edition of Global Legal Insights – Private Credit 2027, published by Global Legal Group.
Read the original chapter via the Global Legal Insights website: Retail capital and private credit: lessons from the first real test
The pressure test
In last year’s edition, we traced private credit’s path from post-crisis workaround to permanent fixture of the global credit ecosystem. We stand by that. However, we gave too little attention to a question that has since moved to the centre of the debate: who is supplying the capital, and does that capital behave the same way as the money the asset class was built on?
The year 2026 has given us a partial answer, and it has not been an entirely comfortable one. The semi-liquid vehicles that channel private wealth and retail capital into direct lending were tested at scale for the first time, and the episode has drawn more attention from the financial press than the underlying data justifies.
We know private credit is resilient (this view is informed by over 25 years of investing through multiple market dislocations, including the Dot-Com Bubble and Global Financial Crisis, and more recently, COVID-19 and the 2022–2023 rate hikes). However, the past year exposed a structural weakness in how retail capital is raised and deployed, and how investors in these vehicles behave when the headlines turn negative. We believe a more durable version of the asset class is achievable, but getting there will require addressing the structure itself rather than relying on a shift in investor sentiment.
Why retail money arrived (and why that was inevitable)
For most of the 2010s, the capital backing private credit loans came from investors it was originally designed for: pensions, insurers, endowments, and sovereign wealth funds with long-dated liabilities; and the internal underwriting capacity to evaluate illiquid, opaque credit risk. The need for new fundraising sources drove attention to the retail channel.
As institutional allocations to private credit matured, the largest managers needed a new channel of growth, and the wealth channel, composed of registered investment advisors, broker-dealers, and eventually retirement plans, represented a vast, largely untapped pool. The vehicles built to access that pool were designed to give retail investors institutional-style exposure while offering periodic liquidity (something institutional funds never had to provide). Non-traded business development companies (“BDCs”), interval funds, and tender-offer funds became the standard wrapper, typically offering quarterly repurchase windows capped at 5% of net asset value (“NAV”).
The wealth channel did not wander into private credit by accident, though. There are materially fewer listed companies in the United States today than there were 30 years ago, and a great deal of the economic activity that once sat in the public markets now sits in private hands. An individual investor with a conventional stock and bond portfolio has gotten access to a progressively narrower slice of the economy and has been asked to accept the full mark-to-market volatility of the public markets in exchange for it.
Private credit offered something different: floating-rate income; senior secured exposure; a valuation that does not gap down because of an oil shock or a geopolitical headline; and access to a class of borrower the retail investor had no other way of reaching. Needless to say, that combination proved enticing. The asset class now sits at roughly $2 trillion in assets under management,1 and the wealth channel has been the fastest-growing part of it for the better part of a decade.
The regulatory backdrop environment continues to accelerate this change. In August 2025, an executive order directed the Department of Labor (“DOL”) and the Securities and Exchange Commission (“SEC”) to facilitate defined-contribution plans to access alternative investments, including private credit.2 The DOL followed with a proposed rule on March 30, 2026, to establish a process-based safe harbour for 401(k) fiduciaries to evaluate private market strategies alongside conventional fund options.3 If finalised, the rule would represent the first formal Employee Retirement Income Security Act safe harbour for private market allocations and potentially opening up access to $10 trillion of 401(k) assets, the vast majority of which are invested in public-market mutual funds.
Catalyst of chaos
In this instance, noise in the public equity market triggered dislocation (versus underlying loan book underperformance).
Through late 2025 and into the first quarter of 2026, fears that agentic AI would undermine the software as-a-service (“SaaS”) model sent listed SaaS equities sharply lower. Given direct lending portfolios carry roughly a quarter of their exposure in software and technology, and at some large non-traded vehicles, software is the single largest sector, some investors were justifiably spooked.4 If the public market had decided that recurring revenue was less durable than it looked, then loans underwritten based on that recurring revenue deserved a second look as well. Pluralsight and Medallia, both originally recurring revenue loans, gave the thesis something concrete to attach to, and the largest non-traded BDC marked down Medallia debt and posted its first monthly loss in three years.5
Consequently, the S&P BDC Total Return Index fell 10.1% in the first quarter and 14% over the trailing 12 months, while the equivalent non-listed index was essentially flat at -0.03%.6 A retail investor could watch the listed proxies for their own asset class fall by double digits while their NAV barely moved and draw the obvious conclusion about marks. Whether or not it was correct, and we do not think it generally was, it was a rational conclusion. From there the market spiralled. Coverage of rising withdrawal requests produced further withdrawal requests, a dynamic one large advisor described to the SEC while disclosing in the same document that its own first-quarter requests had reached 11.6% of shares against a 5% framework.7
What the episode has not produced is a credit event to justify it. The Bank for International Settlements observed this year that generative AI-driven revenue uncertainty had not yet affected these loans, and that neither BDCs nor their equity investors were pricing software exposure differently.8 Investors are not concerned about this year’s interest coverage, but whether these loans, underwritten based on the assumption of steady, recurring revenue, can be refinanced three to five years from now. That is a question we cannot answer yet, which is exactly why it has moved so much money.
What happened in 2026
Non-listed BDCs raised roughly $4.9 billion of new investor capital in the first quarter of 2026, down 46% on the prior quarter and 59% year on year, while managers met approximately $6.9 billion of redemptions.9 That was the first net outflow the perpetual non-traded BDC structure has recorded.10 Behind it, repurchase requests reached 10.4% of NAV in the first quarter and 12.4% in the second, the highest reading Robert A. Stanger & Co. has on record, against a quarterly cap that most of these vehicles set at 5%.11 Of the 16 non-traded BDCs tracked by Fitch, 10 breached their caps in the second quarter, with individual funds ranging from 1.3% to 38.1%.12 Private placement vehicles showed the same pattern on a smaller scale.13
Requests have run at roughly twice the cap
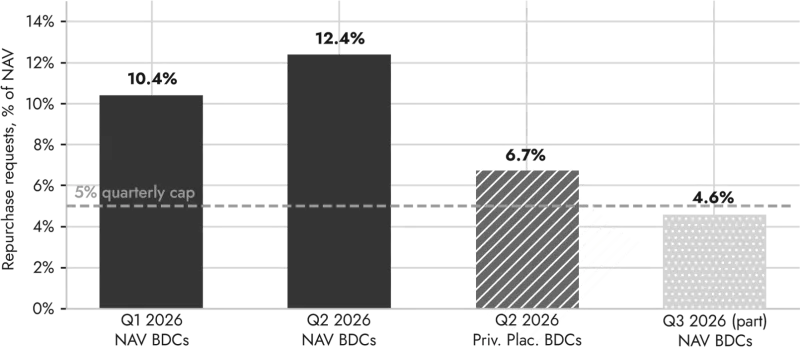
Exhibit 1: Repurchase requests as a percentage of NAV, against the standard 5% quarterly cap. Sources: Robert A. Stanger & Co.; Fitch Ratings; and fund reporting. Note: Q3 2026 reflects the first three NAV BDCs to report and is not a full-quarter figure.
However, redemption requests far exceeded actual redemptions. Managers filled 38% of second-quarter requests, returning about $5.9 billion in the quarter and $12.7 billion year to date. On a cumulative basis, several managers have returned over 70% of the redemption requests to date.
What was asked for, and what was actually paid
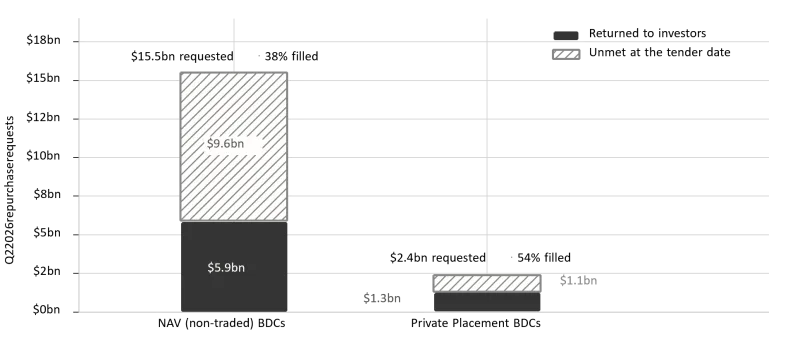
Exhibit 2: Q2 2026 repurchase requests, amounts returned and amounts left unmet. Sources: Robert A. Stanger & Co.; and fund reporting. NAV BDC totals derived from reported amounts returned and the reported fulfilment rate. Unmet requests do not generally carry forward automatically. Note: NAV BDC figures derived from reported amounts returned and fulfilment rate. Unmet requests do not generally carry forward automatically.
The largest non-traded BDC took requests equal to roughly 7.9% of NAV in the first quarter and met them in full, but only by lifting its own repurchase limit from 5% to 7% and taking an additional $400 million of capital from its manager and that manager’s employees.14 One middle-market vehicle shows the whole cycle inside a single fund: requests of 8.5% against a 5% cap in the May tender, filled at roughly 59%, then 4.8% in the July tender, met in full. In both periods, the manager noted that the requests came from approximately 5% of its more than 12,000 shareholders.15 What the sector experienced was not a broad-based stampede, but a determined exit by a small minority, which is a different problem and calls for a different response.
A good portion of the headline demand is an artefact of the mechanism itself: when a fund fills only part of a request, advisors resubmit the shortfall in the following quarter to reach their original target, which inflates the following reading. The Bank of America christened this the proration reflex, and it is why requests were expected to peak in the second quarter even as actual redemptions peaked in the first.16 Because unmet requests must be resubmitted rather than rolled, the third-quarter tenders are a direct test of how much of the unfilled demand was real. The early evidence is that a good part of it did not come back. The first three vehicles to report showed requests at 4.6% of NAV against 7.9% for the same funds a quarter earlier.17
The Federal Reserve has described the redemption risk in these vehicles as manageable.18 While we agree, it is not reason enough to leave the structure alone.
The architecture: gates are a feature, not a failure
It is tempting to call the semi-liquid wrapper “borrowing short, lending long” given investors’ dollars fund five-to-seven-year loans, but they are only granted quarterly redemption opportunities (and have access to no secondary market).
This perspective, however, is an incorrect, or at least incomplete, assessment. The 5% quarterly cap is not a legal requirement. It is a self-imposed ceiling meant to protect staying investors, not inconvenience the ones leaving. Shareholders have no contractual right to full redemption, and managers can generally reduce, suspend, or end the programme. If demand exceeds the cap, requests are prorated, and unmet requests typically do not carry forward, and investors must reapply during the next window. So “unmet demand” reflects a single day’s snapshot, not a queue. Nobody is in default; there is no maturity to miss, no acceleration to trigger.
One caveat: “the 5% cap” covers two different structures. Interval funds must offer 5–25% repurchases at set intervals, may add 2% more, must prorate beyond that and can only suspend via an independent-trustee board vote. Non-traded BDCs run discretionary tender offers that their boards can amend, suspend, or kill outright. Both are commonly described in marketing material as offering quarterly liquidity, but only interval funds are required to provide it.
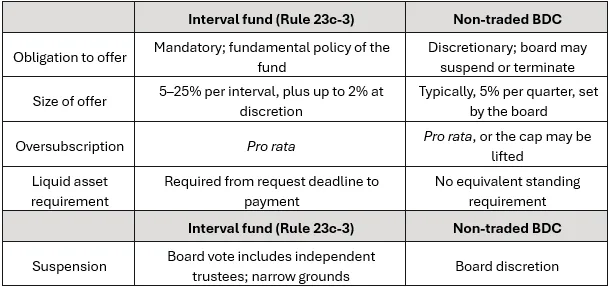
Exhibit 3: What the 5% cap obliges. Summary of the principal structural differences. Individual funds vary and the governing terms are those set out in each fund’s offering documents.
Further, managers rarely meet redemptions by selling assets. A manager maintains excess liquidity by sitting on perhaps 2–3% of NAV in cash and running its debt facilities deliberately below capacity. In doing so, managers then can pay redeeming investors out of the resulting headroom, before bringing the portfolio back to its target leverage. Thus, cash comes off the balance sheet rather than out of portfolio (via liquidation), which is why the sector has been able to return more than $12 billion this year without a fire sale. Organic repayments provide another source of liquidity that is often overlooked. A diversified direct lending portfolio typically receives quarterly repayments equal to several per cent of its NAV, generating another source of liquidity without selling assets, although it does slow down during weaker periods.
As a parallel, when the flagship non-traded real estate vehicle first hit its cap in November 2022, requests peaked at $5.3 billion the following January and the fund prorated for 15 consecutive months before meeting requests in full again in February 2024.19 While it was an uncomfortable 15 months, it was not a collapse. The same vehicle raised $1.2 billion in the first quarter of this year, its strongest quarter in three years, with repurchases down 41%.20 Structures of this kind take a long time to heal but they do, in fact, heal. A fund’s ability to navigate that recovery depends heavily on the manager’s discipline. That is why cash and liquidity management needs to be a key part of General Partner diligence.
Where the fragility lies
We believe there are three genuine weaknesses to the current private credit model (and none of them are the gate):
- The capital must be deployed on arrival. A perpetual vehicle raising monthly subscriptions has no dry powder. Money arrives and must go to work, because uninvested cash is a drag on the distribution rate that sells the product in the first place. A drawdown fund raises a commitment and calls it when the manager finds something worth owning; a perpetual retail vehicle finds something to own because the money has turned up. It is also self-reinforcing: the years of heaviest inflow are the years of tightest spreads and loosest documentation, which is when you would least want to be a forced buyer.
- The liquidity backstop is short-dated. If redemptions are met by drawing on subscription lines, warehouse facilities, and revolving credit, then the fund’s liquidity depends on bank facilities (plus cash on hand) that are typically annual or biennial and that sit with lenders who have their own risk appetite. Those facilities are most likely to be pulled, repriced or left to run off in exactly the conditions that produce elevated redemptions.21 Although, some managers have moved to insulate against this by staggering the maturity wall across their financing facilities, which reduces this risk. The maturity mismatch has not been eliminated by the gate; it has been moved one step up the structure, into the financing stack, where it is less visible and, rather, less discussed.
- Unfunded commitments compete for the same cash. Direct lending portfolios carry revolvers and delayed-draw term loans. Borrowers tend to draw on those to support their own funding needs (working capital, acquisitions, etc.). In a worst-case scenario, a company’s borrowing requests, retail redemption requests, and banks reducing exposure all happen concurrently. Three claims versus one pool of cash; this is the risk we would want stress-tested hardest, and it is the one that receives the least attention in fund reporting.
Underneath all of it sits a fourth point that is not structural at all. The obligation to honour redemptions is far more reputational than it is legal, and reputation is the entire basis on which the next fund is raised. Managers have sold assets and accepted outside capital at unattractive terms rather than exercise a contractual right they unquestionably had, because the alternative was to be known as the “manager who gated”. Fundraising is a confidence business, and confidence cannot be modelled.
The demand side: will private equity firms start asking where the money comes from?
Private equity firms moved to direct lending for a specific set of reasons: certainty and speed of execution; no ratings process; no flex; no syndication risk; and most importantly, reliability of capital across different market environments. During any dislocation, the Broadly Syndicated Loan (“BSL”) market usually shuts down (volatile prices, secondary opportunities competing with primary commitments, etc.), leaving private equity firms unable to access new capital from it. Direct lending has proven to be far more stable, remaining accessible even when the BSL market is not.
However, when the BSL market closes, the capital behind it does not leave. Collateralised loan obligation (“CLO”) vehicles have locked-up liabilities and institutional accounts stay invested, the flows merely slow. Conversely, retail capital actively asks to be returned, on a quarterly cycle, and at the worst possible time. In that narrow sense, the newest source of capital in the asset class may carry more behavioural volatility than the one it was meant to improve upon.
We do not think this ends the retail story, and we would be surprised if private equity firms began interrogating their lenders’ balance sheets in any formal way. However, at the margin, on the largest and most structurally sensitive transactions, a private equity firm choosing between two similar proposals may start to place a value on the stability of the capital behind the commitment.
How capital behaves under stress
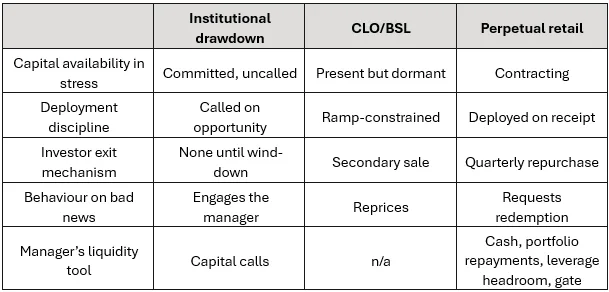
Generalised comparison of structural characteristics. Individual vehicles vary considerably and terms are set in the offering documents of each fund.
Retail capital 2.0
CLO 1.0’s problem was on the asset side. What went wrong was what went into the pool: structured finance paper; high-yield bonds; second lien loans; and layers of complexity nobody could see through. The rebuild addressed exactly that: stripping the collateral back to first lien senior secured loans, lifting par subordination beneath the AAA tranche by roughly 10 percentage points, shortening reinvestment periods, and tightening coverage tests. Risk retention is the piece most often cited and most often misremembered: the 5% Dodd-Frank requirement was vacated as to open-market CLO managers in 2018, two years after it took effect. The improvements stayed, nonetheless.
The CLO liability was right from the beginning: term funded; non-mark-to-market; no investor put; and maturity matched to the loans. That is why CLOs came through a leveraged loan market peaking at an 11% default rate without a single AAA loss. Nobody could run on a CLO, so no manager was ever a forced seller.
The semi-liquid wrapper reflects the opposite case: while assets are overall sound, the liability structure (specifically the promise of periodic liquidity to investors) presents a challenge.
Importing risk retention as the remedy therefore misses the point, because retention addressed alignment in origination rather than liquidity, and in the United States it is no longer in force. The lesson to take from CLOs is not what was done after they broke, but what they got right before anything broke. If you can match the liability to the asset, then there is no run to manage.
We believe the following items could help achieve that alignment:
- Commitment mechanics for the wealth channel. There is no reason a private wealth investor cannot make a commitment that is drawn over time, as an institution does. It removes the deployment-on-receipt problem, lets the manager be patient when spreads are poor, and means an inflow slowdown reduces future capacity rather than eliminating it immediately. The distribution technology is the obstacle here, not the underlying design.
- Longer redemption windows, honestly priced. Quarterly liquidity on a five-to-seven-year loan book is a promise that only holds if most people do not take it up. Annual windows, or a tiered structure in which investors choose their liquidity terms and are paid accordingly, would align the liability far more closely with the assets. An investor who genuinely wants quarterly access should receive a lower yield for it; further, the liquidity supporting that access should be sized and disclosed rather than left to undrawn bank capacity.
- A real secondary market. The most direct fix is the one the industry has been slowest to build. If an investor who wants out can sell to an investor who wants in, the fund does not have to fund the exit at all. The liability transfers instead of running, which is how listed BDCs work, how CLO tranches work, and how private equity secondaries grew into a market clearing tens of billions a year. It would cost the industry something real because a genuine secondary price would trade at a discount to NAV in a period like this one and would make the gap between marks and market visible (which is exactly what investors want).
- Investor education to support it.22 A meaningful share of the redemption pressure this year came from investors discovering terms (e.g., “semi-liquid”) that had been in the prospectus all along. But disclosure is not the same as investor education. Managers who took the trouble to explain the mechanics to advisors and their clients before those mechanics mattered weathered this year better than those who left the marketing material to do the talking.
None of this is a fringe view. The manager of the fund described earlier set out much the same argument in its shareholder letters this year, characterising the 5% quarterly repurchase limit as a deliberate design choice rather than a constraint reluctantly accepted, and framing the programme as an attempt to match the tenor of the fund’s capital base to its investment portfolio.23 This same fund was among the first to see redemption demand fall back below its own cap.
The regulatory current is running the other way. In May, the SEC signalled its intention to permit two interval funds to make monthly rather than quarterly repurchase offers, within the existing aggregate range.24 More frequent liquidity on the same assets is not the same thing as better liquidity; if the industry’s answer to a redemption cycle is to promise access more often rather than to fund it more honestly, we will be back here in a few years having the same conversation with larger numbers.
Is this a credit crisis? We don’t think so
Some of the loudest commentary this year conflated two entirely separate things: investors withdrawing money from a fund; and borrowers failing to pay their loans. A software company does not miss an interest payment because a retail investor in Ohio filed a repurchase request.
If there is a link between fund withdrawals and loan defaults (as the above logic implies), it is not the one people assume; rather, it works in reverse and manifests slowly. Persistent outflows tighten the supply of credit at the margin, which over time makes refinancing harder for the borrowers most dependent on this market. That dynamic is worth monitoring, but, critically, it is not a crisis, and it does not become one in a quarterly reporting cycle.
On the underlying credit, one takeaway is easy to lose in the noise: dislocation often results in lender enhancements. Before the financial crisis, private equity firms were funding leveraged buyouts with 15% to 20% equity. Today the equity check is routinely north of 40% and often above half the capital structure. Interest burdens are undeniably heavier than they were in the zero-rate era, and coverage ratios have compressed accordingly. However, a substantial layer of real, junior, loss-absorbing capital now sits beneath our loans. Consequently, the multiple expansion of the last cycle, the part of the market most would describe as froth, has largely been absorbed by that equity rather than by lenders.
The portfolios have genuine issues, and it would be complacent to suggest otherwise. Concentration in software and technology borrowers is real and has been flagged by the rating agencies. Non-accruals have risen. Payment-in-kind income has grown as a share of the total. Valuations are marked to model, and models are only as good as the people running them. These are the ordinary features of a credit cycle turning, and they will separate disciplined managers from those that simply grew the fastest.
The road ahead: dislocation inspires discipline
We have argued before that private credit’s staying power rests on the value it delivers to borrowers, investors, and banks alike. Nothing this year has changed that. What has changed is that the asset class has, for the first time in its mainstream life, been asked to explain itself.
This reckoning is, on balance, a healthy development. Periods of dislocation are, in our experience, the best environment to deploy capital. Spreads widen. Documentation tightens. Structures that were negotiated away during the boom come back to the table. Vintages struck in years like this one tend to be the ones people are still pleased with a decade later.
There is a second, less obvious benefit. The investors who came into private credit in the last five years now understand what they own in a way that no amount of marketing material would have achieved. They have seen a gate and now understand what proration means. They have learned, at some cost in inconvenience and rather less in capital, that an illiquidity premium is compensation for genuine illiquidity.
Nor is this pattern unique to private credit. The high-yield bond market went through this exact arc a generation ago. Drexel Burnham Lambert’s collapse in February 1990 closed the primary market almost entirely, and the outstanding market roughly halved. The selling came from a concentrated holder base acting for reasons that had nothing to do with the credit: thrifts divesting speculative-grade holdings by statute into a market whose dominant intermediary had just failed. Liability-driven selling into an asset that could not absorb it is not a new problem, and it is not a credit problem.
What the market built after is what matters. Rule 144A, adopted the same year, gave institutional buyers a tradeable channel, and underwriting fees fell from around 3.5% to around 2.5% – a drop that proved permanent.25 The buyer base shifted from concentrated balance sheets to dedicated funds with mandates and published default data to price against. None of it was imposed, rather it was the market building the infrastructure the boom had not required. The market then grew from $181 billion to $567 billion over the following decade.26 It was a larger asset class afterwards, and a better understood one.
Similarly, the non-traded real estate vehicle discussed earlier prorated for 15 consecutive months, and the coverage at the time was every bit as bleak as anything written about private credit this year. It is now raising at its fastest rate in three years, with repurchases down 41%, and the investors who remained did not arrive by accident. They stayed knowing exactly what the terms were, because they had watched those terms operate.
Ultimately, capital that has been through a gate and chosen to stay is worth considerably more to a manager than capital that has never been tested, and the same will be true of the money that comes into private credit over the next few years. That is worth more to this industry over the next decade than the flows we lost this year.
We would rather this have happened at $2 trillion than at $5 trillion. It happened early enough to fix, and the fixes are neither exotic nor expensive. They are questions of structure, terms, and honest description. The managers who take them seriously will raise better capital on better terms and deploy it more patiently than those who wait for the flows to come back and change nothing.
Retail capital in private credit is not in retreat. It has simply had its first difficult year in public, and it will be a better asset class for having had one.
***
Disclaimer
Views expressed are those of the author as at the date of writing and are subject to change. This chapter is for general information only and does not constitute investment advice or an offer of any security. Historical data and market observations are not indicative of future results.
Materials issued by Corinthia Global Management Limited Company Number 14213211. Corinthia Global Management Limited is composed of Corinthia Management US LLC, a Delaware Limited Liability Company, registered as an investment adviser with the U.S. SEC and Corinthia UK Management Limited, authorised and regulated by the Financial Conduct Authority (FRN: 1018170).
***
Endnotes
- CAIA Association, April 2026, citing a private credit market of approximately $2.02 trillion.
- Executive Order, “Democratizing Access to Alternative Assets for 401(k) Investors”, August 7, 2025; published at 90 Fed. Reg. 38921 (August 12, 2025).
- US DOL, Employee Benefits Security Administration, proposed rule “Fiduciary Duties in Selecting Designated Investment Alternatives”, released March 30, 2026.
- Morgan Stanley estimate of software exposure in direct lending; listed BDC sector software exposure per industry analysis, 2026.
- Fund reporting and press coverage, February 2026.
- S&P BDC Total Return Index and Stanger NL BDC Total Return Index, Q1 2026.
- Registration statement filed with the SEC by a private credit adviser, 2026.
- Bank for International Settlements, BIS Bulletin No. 128, 2026.
- Robert A. Stanger & Co., Q1 2026 non-listed BDC data: gross sales (new capital raised) of $4.9 billion, down 46% on Q4 2025 and 59% year on year, against approximately $6.9 billion of redemptions met.
- Moody’s, noting the shift from inflows to the first outflow for perpetual non-traded BDCs in Q1 2026.Robert A. Stanger & Co., Q2 2026 repurchase requests of 12.4% of NAV, a fulfilment rate of 38%, approximately $5.9 billion returned in the quarter and $12.7 billion year to date.
- Robert A. Stanger & Co., Q2 2026 repurchase requests of 12.4% of NAV, a fulfilment rate of 38%, approximately $5.9 billion returned in the quarter and $12.7 billion year to date.
- Fitch Ratings, Q2 2026 data covering 16 non-traded BDCs.
- Robert A. Stanger & Co., Q2 2026 private placement BDC data covering 26 funds with net assets of at least $100 million.
- Fund reporting and Robert A. Stanger & Co., Q1 2026.
- Non-traded BDC shareholder letters, May 2026 and August 2026.
- The Bank of America Global Research, April 27, 2026.
- Q3 2026 reporting to date; reflects the first three NAV BDCs to report and is not a full-quarter figure.
- Federal Reserve commentary on private credit fund redemption risk, 2026.
- Fund investor letters and press reporting, November 2022 to February 2024. Repurchase requests peaked at approximately $5.3 billion in January 2023 and the vehicle prorated for 15 consecutive months.
- Q1 2026 fund reporting.
- Bank facilities may be reduced or withdrawn in stressed markets when liquidity needs are greatest. Re-levering may increase leverage and may not be available on acceptable terms.
- Understanding semi-liquid vehicle terms does not change those terms or guarantee redemption. Investors may be unable to redeem their interests when they choose.
- Non-traded BDC shareholder letter, May 2026.
- SEC notice of intent to grant exemptive relief from certain provisions of Rule 23c-3, May 26, 2026.
- Miles Livingston and Glenn Williams, “Drexel Burnham Lambert’s bankruptcy and the subsequent decline in underwriter fees”, Journal of Financial Economics 84, No. 2 (2007): 472–501.
- The Concise Encyclopedia of Economics, “Junk Bonds”.
Salman MukhtarSalman Mukhtar is a member of Corinthia Global Management’s North American Investment Committee. Salman has extensive experience in building and managing diverse portfolios of middle-market companies across multiple cycles as a principal investor for these businesses for over 20 years. Prior to joining Corinthia in 2024, Salman served as the Head of Execution and Chair of the North America Investment Committee at Barings Global Private Finance. There he oversaw an investment team that underwrote, managed and monitored a diverse portfolio of middle-market leveraged loans on behalf of Barings Global Private Finance and other third-party institutional investors. Salman joined Barings from Bank of America/Merrill Lynch in 2019, where he was Head of Underwriting and Portfolio Management in the Credit Asset Financing Group. Prior to joining the Bank of America, Salman worked at Antares Capital (formerly known as GE Capital Sponsor Finance) as Managing Director, where he was responsible for structuring and executing syndicated and club transactions with a focus on middle-market companies. Salman holds a B.S. in Accounting with a minor in Finance from Purdue University. +1 917 756 4422 Grace FedinetsGrace Fedinets is a Director within North American Investments at Corinthia Global Management, a role she assumed in the Fall of 2025. Her work spans credit underwriting and deal diligence, along with originations and portfolio monitoring. Prior to joining Corinthia, Grace was a Principal on the Credit & Markets team at KKR, focused on private debt and capital markets solutions for financial sponsors and corporate clients. Prior to KKR, she worked at Barings on their Global Private Finance team, where she underwrote and managed middle-market loans, and at BMO within the Diversified Industries Group. Grace holds a B.A. in Economics with a minor in Spanish from DePauw University. +1 332 285 5380 |